Credits management and statistics
CONSELF it is a pay-per-use CFD application available via browser. In order to enjoy this service, you must activate one of the available plans. When entering the application you can access two main pages: the dashboard and the simulations. Before proceeding to the part concerning the CFD, let’s have a look at what is reported in the dashboard. In here you keep under control the whole application and you have at a glance all the information about your simulations and credits availability.
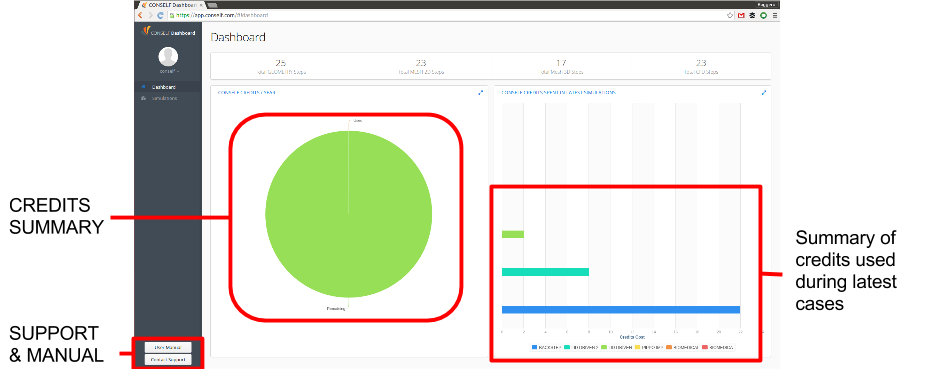
CONSELF dashboard page
Entering into the details of the dashboard, we have:
- Pie chart: report of the used vs available credits. The report refers to your current plan and it gets updated after every simulation finishes.
- Horizontal bars chart: credits used during latest cases. With CONSELF you keep track of your costs in every moment and with this tool you can understand how you are using your credits and thus charging your customer according to this.
- Bottom left buttons: link to this manual and to the CONSELF support team.
More statistics are reported in the dashboard, such as the number of simulation steps performed. You are all invited to suggest even more by contacting the support team.